Indicator Review: Stay The Course
Good Monday morning and welcome back. Let's once again start the week off by reviewing the state of our major indicators and models.
The first step is a review of the price/trend of the market. Here's my current take on the state of the technical picture...
- There can be little argument that the action remains "sloppy"
- The trend of advances being met with intraday selling intact
- Stocks are largely sticking to the seasonal script with a downward bias at present time
- However, as I noted last week, the major indices have actually held up better than usual during this year's "fall swoon"
- Key support level remains intact
- A meaning break below 2120 on a closing basis would be problematic for bulls
- Seasonal tendencies become a potential tailwind in the coming weeks
S&P 500 - Daily 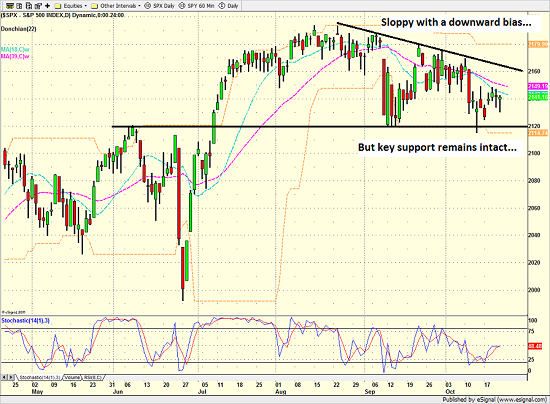
View Larger Image
From a longer-term perspective (e.g. looking at a weekly chart of the S&P 500)...
- Stocks remain in what appears to be a consolidation phase after strong run up from February 11th low
- Important to keep the big picture in mind
- Stocks experienced what looks to have been what I call a "mini bear" from August 2015 through Feb 11, 2016
- We believe stocks embarked on new bull phase on Feb 12, 2016
- We also believe the current bull is occurring within a larger, secular bull cycle that began in March 2009
- History shows that bulls that occur within context of secular bull cycle produce average gains of 107% on S&P 500 (Source: Ned Davis Research)
- So... Despite the myriad of worries, I remain constructive on stocks and expect the bulls to retake possession of the ball at some point in the near future
S&P 500 - Weekly 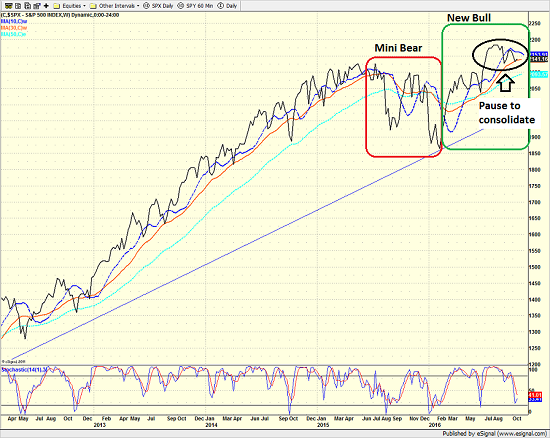
View Larger Image
Next, let's look at the "state of the trend" from our indicator panel. These indicators are designed to give us a feel for the overall health of the current short- and intermediate-term trend models.
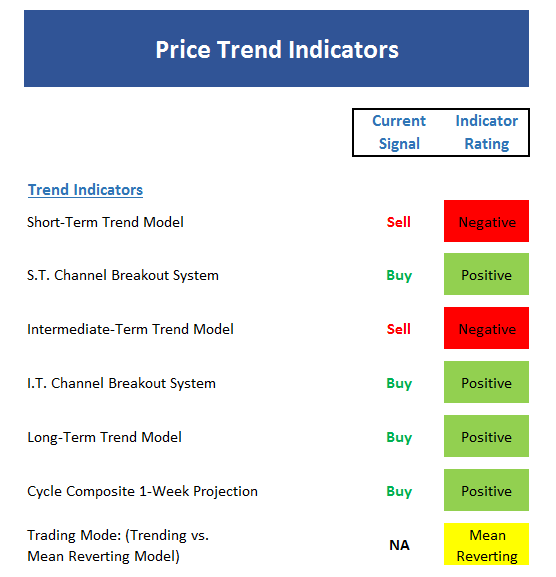
- The market remains in a mean reversion mode at this time
- As such, the play book says longer-term investors should ignore shorter-term price movements and traders should "ride the range"
- The trend board isn't as negative as one might expect after the prolonged "sloppy period"
- Note that I employ Channel Breakout Systems differently than most folks during mean reverting periods
- The Cycle Composite points to weakness early then a strong rally over next two weeks
- Overall, I'll rate the trend board as neutral
Now we turn to the momentum indicators...
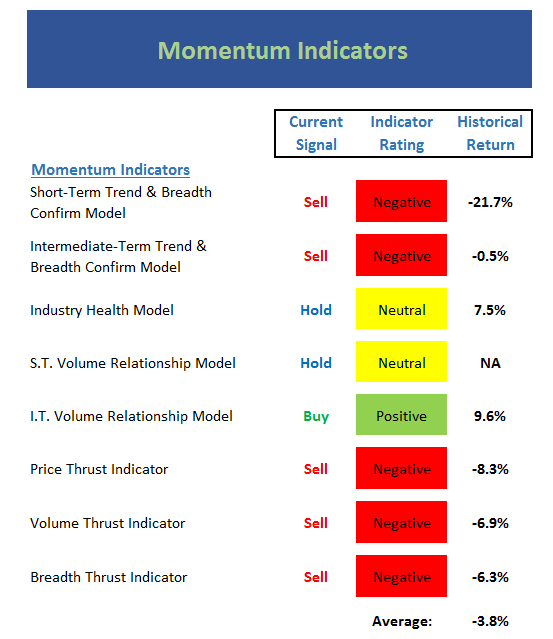
- The momentum board remains fairly ugly as there is no real momentum in either direction at this time
- All three Thrust indicators remain negative
- The Industry Health Model, which has refused to turn outright bullish so far in this cycle, remains neutral
- Short-term Volume Relationship indicator exactly neutral at the moment, which doesn't happen often
- Longer-term Volume Relationship indicator still in good shape
Next up is the "early warning" board, which is designed to indicate when traders may start to "go the other way" -- for a trade.
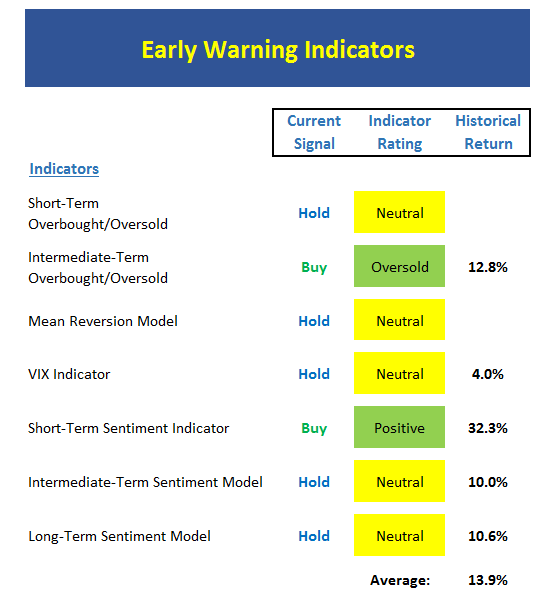
- Important to note that the Early Warning indicators work best when the "stars align" (meaning the market is oversold on all three time frames, sentiment is weak, our mean reversion model is green, and the VIX gives a buy)
- Currently the board suggests the bulls have an opportunity, but the table does not yet appear to be set for a pound-the-table buy point from a longer-term perspective
- What would it take to get the stars to align? A washout to the downside would likely do the trick.
Now let's move on to the market's "external factors" - the indicators designed to tell us the state of the big-picture market drivers including monetary conditions, the economy, inflation, and valuations.
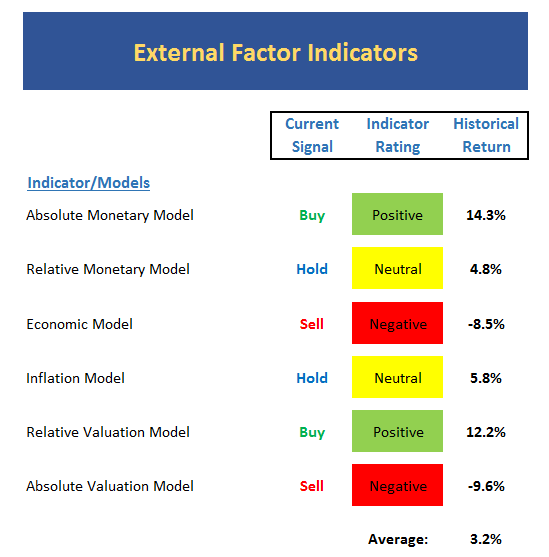
- This board usually doesn't change much, however this has not been the case lately
- Recently the Relative Monetary and the Inflation Models both turned yellow
- This week, the Economic Model went negative
- Note that the Economic model is designed to "call" the stock market based on economic inputs - NOT to "call" the economy
- Our models designed to indicate the "state of the economy" remain positive on balance
- I'll be watching our valuation models closely to see if the earnings picture causes the valuation situation to improve
Finally, let's review our favorite big-picture market models, which are designed to tell us which team is in control of the prevailing major trend.
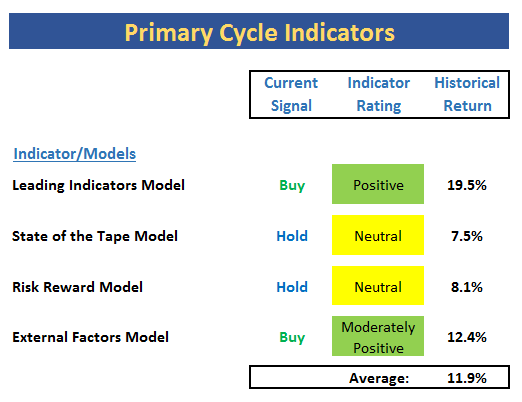
- Glancing at the board, I'll call this a moderately positive situation
- The two-month long "sloppy period" has weighed on some of our tape and trend indicators
- The Leading Indicators model slipped to 60% this week. Still a positive reading but the decline is worth noting
- The historical average remains above the long-term trend (approximately 10% per year)
The Takeaway...
Let's see here... The "sloppy period" continues. Stocks are oversold. The market remains in a mean-reverting mode. The cycle composite suggests the seasonal winds begin to favor the bulls soon. The message from the earnings parade so far is pretty good. The Fed will likely raise rates in December (and everybody knows it). And the election uncertainty will end in 2 weeks. Therefore, it is probably best for longer-term investors to ignore all the daily gyrations and stay the course.
Current Market Drivers
We strive to identify the driving forces behind the market action on a daily basis. The thinking is that if we can both identify and understand why stocks are doing what they are doing on a short-term basis; we are not likely to be surprised/blind-sided by a big move. Listed below are what we believe to be the driving forces of the current market (Listed in order of importance).
1. The State of the Earnings Season
2. The State of Global Economies
3. The State of Global Central Bank Policies
4. The State of U.S. Dollar
Thought For The Day:
"Expect the best; convert problems into opportunities; be dissatisfied with the status quo and focus on where you want to go." --Denis Waitley
Wishing you green screens and all the best for a great day,

David D. Moenning
Chief Investment Officer
Sowell Management Services
Looking for a "Modern" approach to Asset Allocation and Portfolio Design?
Looking for More on the State of the Markets?
Investment Pros: Looking to modernize your asset allocations, add risk management to client portfolios, or outsource portfolio design? Contact Eric@SowellManagement.com
Disclosures
The opinions and forecasts expressed herein are those of Mr. David Moenning and may not actually come to pass. Mr. Moenning's opinions and viewpoints regarding the future of the markets should not be construed as recommendations. The analysis and information in this report is for informational purposes only. No part of the material presented in this report is intended as an investment recommendation or investment advice. Neither the information nor any opinion expressed constitutes a solicitation to purchase or sell securities or any investment program.
Any investment decisions must in all cases be made by the reader or by his or her investment adviser. Do NOT ever purchase any security without doing sufficient research. There is no guarantee that the investment objectives outlined will actually come to pass. All opinions expressed herein are subject to change without notice. Neither the editor, employees, nor any of their affiliates shall have any liability for any loss sustained by anyone who has relied on the information provided.
The analysis provided is based on both technical and fundamental research and is provided "as is" without warranty of any kind, either expressed or implied. Although the information contained is derived from sources which are believed to be reliable, they cannot be guaranteed.
David D. Moenning is an investment adviser representative of Sowell Management Services, a registered investment advisor. For a complete description of investment risks, fees and services, review the firm brochure (ADV Part 2) which is available by contacting Sowell. Sowell is not registered as a broker-dealer.
Employees and affiliates of Sowell may at times have positions in the securities referred to and may make purchases or sales of these securities while publications are in circulation. Positions may change at any time.
Investments in equities carry an inherent element of risk including the potential for significant loss of principal. Past performance is not an indication of future results.
Advisory services are offered through Sowell Management Services.
