While We Wait...
While we wait on this week's big events, which include the FOMC announcement and Janet Yellen press conference Wednesday afternoon, the election results in the Netherlands, meetings of the Bank of Japan, the Bank of England, and the Swiss National Bank on Thursday, and the Brits triggering Article 50 to initiate the BREXIT, I thought it would be a good idea to check in with our cycle work.
With just about everybody and their grandmother expecting a correction in the near-term, I wanted to know if the seasonal tendencies favored some sort of setback. And while I have learned the hard way over the past thirty years to be leery of the crowd - especially when they are absolutely positive about what will come next - every once in a while, the thing that EVERYBODY expects to happen winds up being a self-fulfilling prophecy.
Before we begin though, let's be clear about one thing - there is no such thing as a crystal ball that can predict the future in Ms. Market's game. No, as the late Marty Zweig used to say, "Those who rely on a crystal ball will wind up with an awful lot of crushed glass in their portfolios."
With that said though, it is fair to say that the stock market does tend to follow seasonal patterns at times. But at other times, well, not so much.
In working with the seasonal patterns for going on twenty years now, I have learned that when the market is "in sync" with the historical/seasonal cycles, it tends to stay in sync for some time. But... there are also times when Ms. Market does whatever she darn well pleases for extended periods.
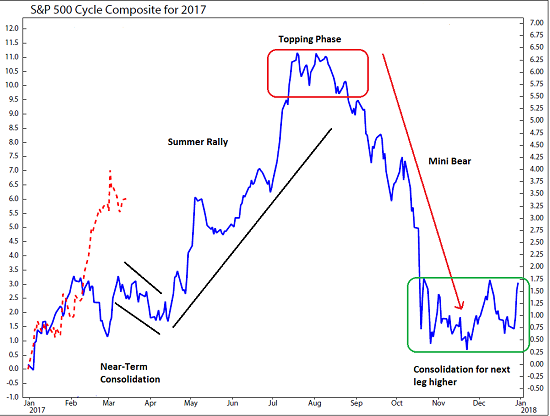
The beginning of 2017 has thus far seen examples of both. As the chart below shows, stocks followed the January pattern to a "T" but then completely diverged in February by continuing to move higher when the cycle composite suggested stocks would falter.
To review, the cycle composite, which is the brainchild of Ned Davis Research Group, combines the one-year seasonal, the four-year Presidential, and the ten-year decennial cycles going back to 1928 in order to create a composite cycle projection. In short, the blue line is the cycle composite's projection of the market's trend and the red line is the movement of the S&P 500 itself.
So, the first point to make is that the market is currently NOT in sync with the composite's projection. This is not necessarily a bad thing but rather an observation that the market may continue to diverge from the composite in the near-term.
But with that caveat in place, look at the general trends that I've drawn onto the chart. First, note that the composite calls for a pullback - or what I've labeled "Near-Term Consolidation" into the middle of April. This would fit perfectly into the correction that nearly everyone in the game is looking for right now.
But from there, the nattering nabobs of negativity could be fooled - in a big way - as the historical cycles suggest a meaningful "summer rally" will occur. This is the kind of rally that can create the type of capitulation that tends to occur at important tops in the market.
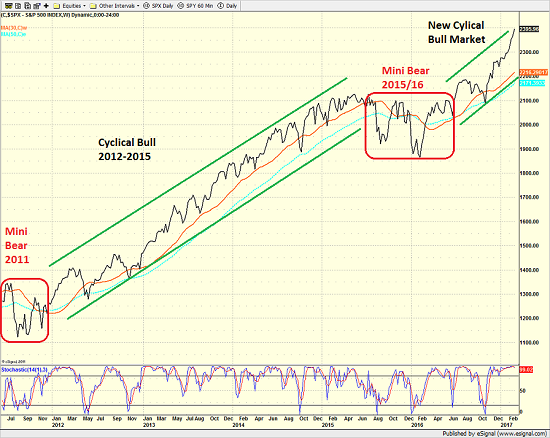
From there, things look like they could get ugly as the year's gains are wiped out by what I would call a "mini bear market." In my opinion, this might be something like what we saw from August 2015 through February 11, 2016.
To help put things in perspective, I'll reuse a chart I did a couple weeks ago that shows the "mini" or "cyclical" trends in the market over 5+ years.
S&P 500 - Weekly 
View Larger Image
To be sure, I am no better at predicting the market than anyone else. And it is just plain silly to think that the market will play out according the cycle composite's projection. However, I find it helpful to be aware of what "could" transpire down the road as it helps me plot strategy from a big-picture standpoint.
So for now, the crowd could very well be right and stocks could certainly pull back in the near-term. But from there, be aware that things could heat up in a 1987-style "melt-up" that could ultimately lead to a topping phase.
As such, traders should be ready to buy the dip in the coming days/weeks while long-term investors should begin thinking about buying the next big dip that could happen later this year.
Thought For The Day:
Remember that happiness is a choice. What will you choose today?
Current Market Drivers
We strive to identify the driving forces behind the market action on a daily basis. The thinking is that if we can both identify and understand why stocks are doing what they are doing on a short-term basis; we are not likely to be surprised/blind-sided by a big move. Listed below are what we believe to be the driving forces of the current market (Listed in order of importance).
1. The State of the Fed's Next Move (After Wednesday)
2. The State of Trump Administration Policies
3. The State of the U.S. Economy
4. The State of Global Central Bank Policies (Think ECB pulling back on QE)
Wishing you green screens and all the best for a great day,

David D. Moenning
Chief Investment Officer
Sowell Management Services
Disclosure: At the time of publication, Mr. Moenning and/or Sowell Management Services held long positions in the following securities mentioned: none. Note that positions may change at any time.
Looking for a "Modern" approach to Asset Allocation and Portfolio Design?
Looking for More on the State of the Markets?
Investment Pros: Looking to modernize your asset allocations, add risk management to client portfolios, or outsource portfolio design? Contact Eric@SowellManagement.com
Disclosures
The opinions and forecasts expressed herein are those of Mr. David Moenning and may not actually come to pass. Mr. Moenning's opinions and viewpoints regarding the future of the markets should not be construed as recommendations. The analysis and information in this report is for informational purposes only. No part of the material presented in this report is intended as an investment recommendation or investment advice. Neither the information nor any opinion expressed constitutes a solicitation to purchase or sell securities or any investment program.
Any investment decisions must in all cases be made by the reader or by his or her investment adviser. Do NOT ever purchase any security without doing sufficient research. There is no guarantee that the investment objectives outlined will actually come to pass. All opinions expressed herein are subject to change without notice. Neither the editor, employees, nor any of their affiliates shall have any liability for any loss sustained by anyone who has relied on the information provided.
The analysis provided is based on both technical and fundamental research and is provided "as is" without warranty of any kind, either expressed or implied. Although the information contained is derived from sources which are believed to be reliable, they cannot be guaranteed.
David D. Moenning is an investment adviser representative of Sowell Management Services, a registered investment advisor. For a complete description of investment risks, fees and services, review the firm brochure (ADV Part 2) which is available by contacting Sowell. Sowell is not registered as a broker-dealer.
Employees and affiliates of Sowell may at times have positions in the securities referred to and may make purchases or sales of these securities while publications are in circulation. Positions may change at any time.
Investments in equities carry an inherent element of risk including the potential for significant loss of principal. Past performance is not an indication of future results.
Advisory services are offered through Sowell Management Services.

